MSOS: How Low It Could Go
- Dec 7, 2025
- 6 min read

I discussed the crash of MSOS again on 11/18, when it closed at $3.16, and it has rebounded to $3.89. Clearly, it is highly volatile! I discussed why it was crashing and how low it could go and shared some good alternatives. Today, I want to discuss the current holdings, the bounce, the acceleration of redemptions of the ETF, and my updated view on the potential downside.
MSOS Is Extremely Concentrated In Its Holdings and Is Leveraged
AdvisorShares does a great job of updating its portfolio online for shareholders or analysts to look at it. On Friday, the update showed that the NAV is $3.86, which was $0.03 below the closing price. Here are the largest positions:
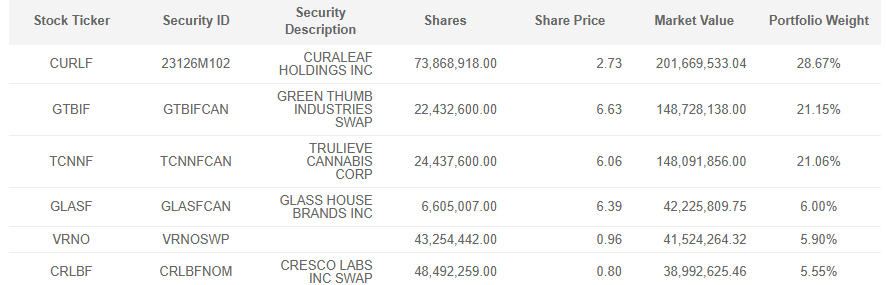
The top three holdings, which include Curaleaf (CURLF), Green Thumb Industries (GTBIF) and Trulieve (TCNNF), make up 70.9% of the assets, which is extremely high and not related to their market caps or their revenue or profits relative to peers. These six names, all above 5% each, make up 88.3% of the portfolio, which holds 14 other names that average less than 1%.
I do like GTBIF, but I think that CURLF is absurdly overpriced and has a terrible balance sheet. I think that TCNNF is exposed big-time to a weakening Florida market and plays some very bad games with its 280E tax liabilities.
The MSOS ETF currently has an NAV of $703 million, but its stocks add up to $723 million, suggesting that they are leveraged at 2.8%. This makes the return to shareholders a bit more volatile than the changes in the prices of the underlying securities.
One stock that the ETF may sell is Village Farms (VFF), which has no U.S. state-regulated operations and lost out in the recent Texas license awards. That position is 3.4% of the ETF and could be sold to make up the imbalance between its shares outstanding and its investments.
The MSOS Chart Has Rolled Over
On 11/13, MSOS gapped down as I pointed out in my piece on 11/18, and that gap (to $3.98) was filled on 12/4:

This six month chart captures the 52-week high, set in August above $6.00, as well as almost the 52-week low set near $2.00 in June. In April, it set an all-tie low of $2.02 during trading, but the $2.06 low of 6/20 was the all-time closing low.
I see no gaps above or below, and the closing price of $3.89, which is substantially higher than when I last wrote a few weeks ago, is closer to the middle of that one-year range but slightly below the $4.02 level. The pullback in November, at its low of $2.96, represented a retracement of 76.5% from the all-time low of $2.02 to the subsequent high of $6.02.
I see falling peaks over the past few months and think the high set on Friday of $4.02 may prove to be another bounce peak. Note that the volumes have dried up!
Redemptions of MSOS
If one could look at a chart and predict the future with full confidence, it would reduce the need to give much additional thought, but that is not the case in my opinion. With MSOS, what happens with 280E taxation is a very big thing that could cause the MSO holdings to go up a lot or to go down a lot. This whole rescheduling thing has seemed very suspicious to me, and I don't expect it to happen, but perhaps it will.
I have been warning here and in other places that MSOS faces redemption risks. The ETF gained a lot of assets for years, but in late 2022 and into early 2023, the share-count fell. Then the potential rescheduling came to life in 2023 and into 2024, with the market peaking the day the DOJ said that it was going to move towards rescheduling. MSOS peaked at $11.37 with a high that day (4/30) of $11.26.
This year, there was a small redemption in the spring, with shares outstanding falling from 136.825 million in early March to 132.15 million by mid-April, a 3.4% decline. Then they shot up again beginning in June and accelerating in August, peaking at 188.61 million on November 18th, up 44.5% year-to-date. Well, they were hit with share-count reductions that next week, with a decline of 2%, and then this past week they fell 1.3% to 182.24 million, which is still up 39.6% year-to-date.
Just looking at the top three holdings, they have all been reduced by the ETF, with Curaleaf down 2.7% and GTI and Trulieve down 2.6% after the MSOS share-count fell 3.4% If MSOS gets more redemptions, it will be selling a lot of these three names, as they represent a massive 70.8% currently.
My MSOS Outlook
I think that MSOS could make a new all-time low. The ETF trades at only a slight premium to its net asset value, so this is not the driver. My view is that the underlying assets will fall in price. For this to happen, investors must migrate from their confidence that 280E is going away to a view that it will remain. This has already started to change, but clearly many are still expecting 280E to go away.
I am the first to say that MSOs are cheap, but I also point to their risks. If 280E taxation remains, many companies will struggle with debt. The largest MSO by market cap or in this ETF has a terrible balance sheet, and I am very negative on Curaleaf. On Thursday, I wrote at New Cannabis Ventures in the weekly news piece that there is no reason to own Curaleaf. The stock is up 75% year-to-date, and if it were to return to its year-end price of $1.56, that would be a decline of 43%. Given its large weight, that would cause a 12% drop in MSOS roughly. Of course, CURLF traded as low as $0.68 in the spring. I like GTI, and I think it can hold up well if 280E taxation is perceived to be sticking around.
If Curaleaf comes back to its year-end level, it would still be expensive relative to peers if they were unchanged. For purposes of making a prediction, I am going to assume that GTI is unchanged, that Curaleaf falls 43% and that the other MSOs fall 10%. If this were to happen, MSOS would drop by about 17.4% based on the current holdings. Assuming the price is the current NAV adjusted for this loss, it would be $3.19. This is a very optimistic outlook.
A more realistic scenario would have sharper losses. Let's assume that GTI drops 10% and that Curaleaf goes back to $1. The rest of the stocks would probably drop 20-25%. Assuming 20%, the overall drop, based on the current position weights, would be 22.7%. Applying this to the current NAV of $3.86, the price would be $2.99, the very recent low.
These calculations don't include the potential redemption action, which could lead to bigger losses, especially in the large positions that would need to be liquidated largely. Given the very low volumes, the rolling over of the 50-day moving average, the lower highs and lower lows recently, I think that it could lead to big selling by investors fearful of more debt situations. There have already been several large MSOs that have had to turn over assets to their debt-holders. Get ready for more!
Conclusion
MSOS had a big bounce that began before the news in mid-August (hmm), and it was too big. That bounce has ended, with the recent low of MSOS well below where it was trading on 8/8 before the news hit. The news isn't working out - 280E taxation has not gone away, and rescheduling has not taken place and may not take place. We have been in a bear market for almost 5 years, and MSOS is way down from its all-time high of $55.91 in 2021. It's also way down from the peak ahead of the elections last year of $7.61 in October 2024.
If 280E goes away, it will be good fundamentally. I continue to believe that there are other ways to play this, like the cannabis REITs or other ancillary companies. I do like some of the Canadian LPs now too. If you are highly confident that 280E is going away, go for it! I am not confident, but I see the risks to the MSOs if it remains. If you want to be invested in an MSO, some stand out compared to others for being less risky, like GTI. If you want to take risk and be in a big MSO, I like Verano (VRNO).
I laid out some scenarios where much lower prices are ahead for the MSOS ETF, but I never answered the question in the title. It won't go to zero, but it could break the all-time low of $2.02 in my view. I am highly confident that it will test $3.00 again, and that is a lot lower than the current price.


Comments