


Investors Should Limit Investment in XLE, the Energy ETF

The second full week of July saw stocks pull back with bonds roughly unchanged. This has been happening a lot recently, though the first full week in July had strong stocks. Last week, I discussed some ways to beat the S&P 500 index.
A Look at the Market
The S&P 500 has returned 9.6% with dividends included, and the price is up 9.0% for SPDR S&P 500 ETF (SPY) in 2026 so far. This leaves the market on track to post a return for the full year below 20%. At the same time, iShares Core US Aggregate Bond ETF (AGG) has declined in price in 2026. With dividends included, the return has been 0.3%, which is well below cash.
The big story last week was weakness in Technology and strength in Energy. Coming into July, Technology was winning after a big Q2, but now the leading large-cap sector is Energy:

The overall market benefits little from surging energy stocks, which currently comprise only 3.2% of the S&P 500. This is a tiny fraction of the Technology exposure that totals 36.8%. Plus, higher costs of energy hurt consumers and businesses!
Energy stocks are rallying in 2026 due to the war with Iran that just won't end. Looking at Energy and Technology since the end of 2019, Technology is winning big, with the total return of Energy lagging the S&P 500 slightly:

I had no XLE exposure at the beginning of 2026, and I have none now. What exactly is XLE? It holds 21 stocks in the S&P 500 that are in the Energy sector. Two very large portions are ExxonMobil (XOM) at 20.2% and Chevron (CVX) at 14.9%. The return of these two has been below the 34.0% average year-to-date total return for each of the 21 members:

Three of the stocks have returned more than twice as much as XLE, while two have experienced negative returns.
I generally don't "chase the winners" like XLE, and I have never written an article at Seeking Alpha on the ETF. It is a widely followed ETF there, with 105K followers, the highest of the 11 State Street S&P 500 Sector ETFs. Technology is in second-place, with XLK having 82,500 followers. To me, this is kind of a negative to be so widely followed!
I think that Seeking Alpha has invested a lot in its Quantitative investing effort, but I do have a view that "buys" are not always buys and that "sells" are not always sells. The Quantitative Rating currently for XLE is 4.42, a Buy. XLK is also a Buy at 4.45. Here are the ETF grades the system kicks out currently for the two of them:

To me, these are very similar today and were pretty similar in January. I am not sure why "Dividends" is so good for XLK. XLE has a nice yield of 2.6%, while XLK yields 0.5%. Looking at the underlying metrics, it seems that the Quant model does not like the low yield on XLK, but it values highly the consecutive years of growth and consecutive years of dividend payments. The XLE dividend grade is hurt by the current yield (below the median) and by the low growth.
I am not currently interested in the XLE ETF for my model portfolio, but I am not bearish on it. The Energy sector has come a long way over the last few years in terms of improving balance sheets and controlling costs. I don't like the fact that XLE has 35% in just two stocks or that it has run up so much since February, but I do like some Energy stocks. There is one that I like that my wife bought early in the year, sold on the big post-Iran rally and then bought back at a lower price. I just added one of the XLE members to my own watch list (one of the two that are down year-to-date), and I include another one from this list on the watch list as well. The total Energy stocks for this Texan are 8 of the 108 stocks on the watch list.
My model portfolio is very underweight stocks right now, with the full exposure in two ETFs. The total Energy exposure in the larger position, a mid-cap dividend-focused ETF, is 1.6% in one holding, and the large-cap focused ETF holds 1.4%, including the two big ones and only the two big ones in XLE.
So, I keep my eyes on XLE, but it's not super-exciting to me now. I am aware that I am underweight the Energy sector and will look to buy meaningful dips. Over the past three years, XLE has traded as low as $37.24 (April 2025) and as high as $63.46 (March 2026). It closed at $57.68, and there is an open gap in trading from $55.24 that was created this past week.
XLE could keep rallying, but it could mean lower stock prices overall if the driver is higher oil prices. Being underweight stocks would make sense in this scenario. Investors should not be jumping into XLE in my view.
ETF Model Portfolio Update
This ETF model portfolio, which is measured against 60% SPY and 40% AGG, is up relative to its benchmark. This week, I did several trades, which were published on here instead of on my Seeking Alpha blog. For those who would like real-time alerts (free of charge for now), just subscribe to the blog.
I posted one article this week at Seeking Alpha about ETFs and another one at TalkMarkets:
Going into the week, my model portfolio equity exposure totaled 30.8%, spread out across two ETFs. Here is what I did this week:
Tuesday: I increased Vanguard Short-Term Inflation-Protected Securities Index ETF (VTIP) and exited iShares Bitcoin Trust ETF (IBIT), adding to VTIP again and to iShares TIPS Bond ETF (TIP).
Thursday: I reduced ProShares S&P 500 Dividend Aristocrats ETF (NOBL).
Friday: I reduced NOBL again and added a new position in IBIT.
Here is the current model portfolio, which now has 28.5% equity exposure in two ETFs and fixed income exposure in four ETFs that totals 68.0%:
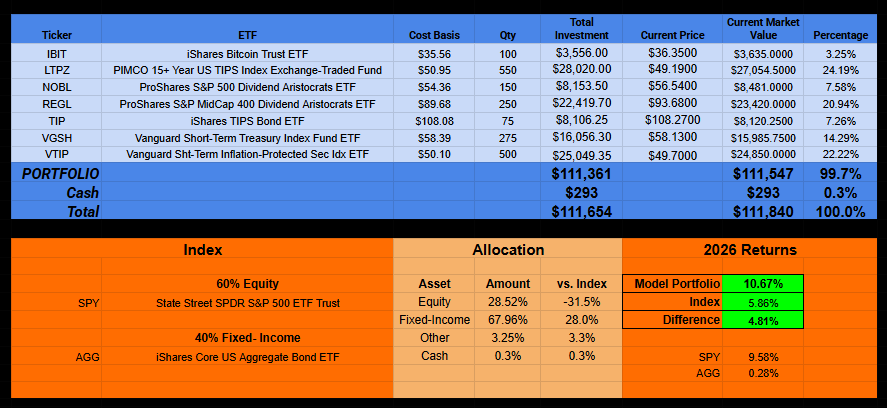
I have been wrong this year, at least so far, as stocks keep rallying. The rally has been until Friday six weeks ago, when they had their worst day of the year. Since then, the S&P 500 has not made a new high, though it sure has tried. Small-caps did again make a new high in early July. Despite being underweight stocks all year, my return relative to the 60/40 index is higher by about 4.8% in just over six months. In fact, while the S&P 500 fell this week, and the Aggregate Bond Index rose slightly, this model portfolio fell less than the index during the week.
The year-to-date strong relative performance is not due to superior returns on my current equity ETFs. My TIPS ETFs have done okay relative to AGG, but they aren't exactly boosting the return. VGSH isn't helping too much either. So, what has it been? I have had positive returns from three ETFs, two of which I no longer hold and one of which is down a lot year-to-date that I just repurchased recently, and there has been some good trading.
How Can I Help You?
I enjoy analyzing ETFs and stocks, and I like sharing my thinking in writing. I am considering starting a subscription service or joining one that is already being published. What things would you as an investor like to see offered?
If you are an investment professional, I would like to work with you as well. I can help educate financial consultants about the ETFs, and I can work with management at investment firms to help create model portfolios or potential ETF investments. Please let me know if your firm would be interested in this.
My ETF articles at Seeking Alpha, written under the alias The Intelligent ETF Investor, share a lot of my ideas.


Comments